
Want to know if your B2B strategy is truly customer-focused? Here’s how to measure it with 8 key metrics that evaluate customer retention, loyalty, satisfaction, and engagement. These metrics help you track progress, pinpoint areas for improvement, and align your efforts with customer needs.
Key Metrics to Measure:
- Customer Retention Rate (CRR): Tracks how well you retain customers. Aim for low churn rates.
- Net Promoter Score (NPS): Measures customer loyalty and likelihood to recommend your brand.
- Customer Lifetime Value (CLV): Estimates the revenue generated per customer over time.
- Customer Satisfaction Score (CSAT): Gauges customer satisfaction with specific interactions.
- Customer Effort Score (CES): Assesses how easy it is for customers to interact with your business.
- Customer Engagement Data: Tracks interaction patterns like website activity or product usage.
- Customer Feedback Systems: Collects actionable insights to improve services.
- Organizational Audits: Evaluates internal alignment and strategy effectiveness.
Why It Matters:
- Retention is cheaper than acquisition: Keeping customers costs 4x less than acquiring new ones.
- Loyal customers drive growth: Companies with high NPS grow twice as fast.
- Better experiences boost revenue: 86% of customers pay more for improved experiences.
Quick Comparison Table:
| Metric | Purpose | Example Goal |
|---|---|---|
| Customer Retention Rate | Reduce churn | Monthly churn below 3% |
| Net Promoter Score | Measure loyalty | NPS between 50-80 |
| Customer Lifetime Value | Maximize long-term revenue | LTV:CAC ratio of 3:1 or higher |
| Customer Satisfaction | Improve interaction quality | CSAT between 75-85% |
| Customer Effort Score | Simplify interactions | High CES reduces churn by 40% |
| Engagement Data | Track customer interactions | Increase active usage by 20% |
| Feedback Systems | Gather actionable insights | Improve NPS via feedback loops |
| Organizational Audit | Align teams and strategies | Boost lead conversion rates |
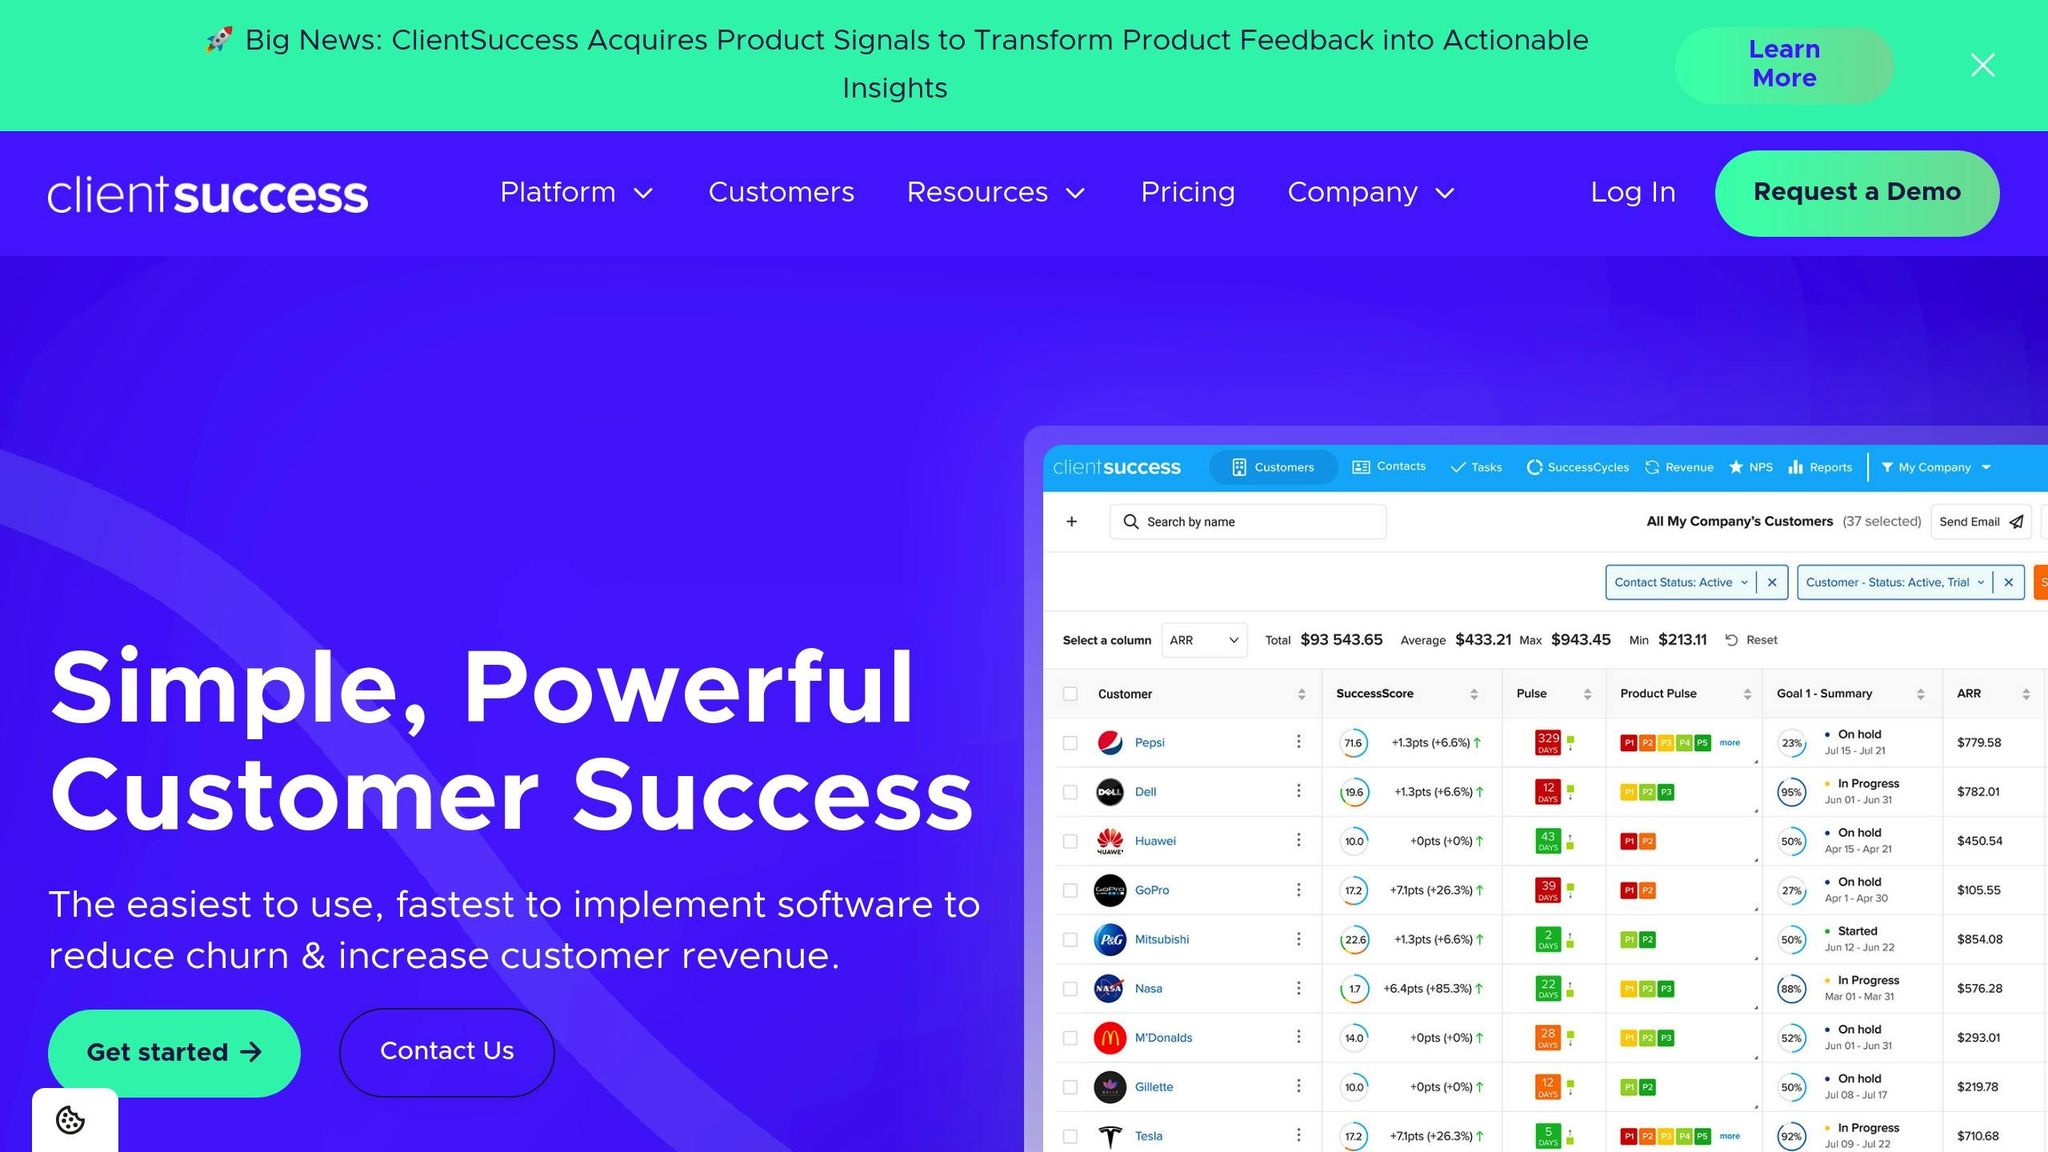
ClientSuccess Webinar – Customer Success Metrics that Matter
1. Customer Retention Rate
Customer Retention Rate (CRR) shows how well your B2B strategy keeps customers coming back. Did you know that 65% of an average company’s revenue comes from existing customers? [3]
Here’s how you calculate CRR:
| Component | Description |
|---|---|
| E | Customers at the end of the period |
| N | New customers acquired during the period |
| S | Customers at the start of the period |
| Formula | CRR = ((E – N) / S) × 100 |
For perspective, gaining a new customer costs about four times more than keeping an existing one [3].
Retention benchmarks to aim for:
- Small B2B businesses: Monthly churn rate of 3-5% [2]
- Enterprise-level organizations: Churn rate below 1% [2]
- Average company: Loses 10-25% of its customer base annually [3]
These benchmarks are essential for shaping a customer-focused strategy and prioritizing resources effectively.
How to improve your retention rate:
Keep an eye on lifecycle length, monitor product usage to catch early signs of churn, and offer proactive support.
Oren Smith explains it best:
"After all, the more revenue you generate from your existing customers, the less pressure you put on your customer acquisition efforts. In other words, you’ll be less pressured to acquire new customers if your existing ones continue to buy." [3]
By regularly tracking CRR, your team can:
- Spot changes in customer behavior
- Fine-tune strategies based on retention trends
- Prioritize high-value accounts
- Launch targeted retention programs
Retention insights are crucial. Next up: Net Promoter Score, a metric that measures customer loyalty.
2. Net Promoter Score
Net Promoter Score (NPS) is a way to measure customer loyalty and assess growth potential. Studies show that companies with higher NPS tend to grow twice as fast as their competitors [4].
To calculate NPS, ask customers how likely they are to recommend your brand. Then, group their responses into the following categories:
| Category | Score Range | Description |
|---|---|---|
| Promoters | 9-10 | Loyal customers who help drive growth |
| Passives | 7-8 | Satisfied but may switch to competitors |
| Detractors | 0-6 | Unhappy customers who may harm your reputation |
NPS is determined by subtracting the percentage of Detractors from the percentage of Promoters, giving a score between -100 and +100. Bain & Co reports that the fastest-growing companies typically have NPS scores between 50 and 80 [5].
Once you’ve calculated your NPS, here are ways to act on the results:
- Use both transactional and relational NPS: Transactional NPS gathers feedback at specific interaction points, while relational NPS measures overall brand perception. For instance, Slack uses NPS at various stages, like onboarding and feature adoption, to identify and address issues early [4].
- Set up a closed-loop feedback system: Share NPS insights in real time with teams like sales, customer service, and leadership.
- Survey strategically: Conduct surveys quarterly to improve retention. For B2B clients, involve multiple stakeholders within each account to get a broader view of satisfaction.
A practical example? Tesla expanded its Supercharger network based on high NPS feedback, showing how customer insights can guide business decisions [4].
Key Metrics to Consider
- 83% of consumers trust recommendations from friends and family [4].
- 59% of customers refer brands they trust to others [4].
- 66% of U.S. consumers spend more on brands they are loyal to [4].
"It’s not the score that matters; it’s what you do with it to make promoters that really counts." [5]
To maximize the impact of your NPS, integrate the results into your CRM for real-time updates and quick follow-ups. This approach can help you turn insights into actionable steps that support growth.
3. Customer Lifetime Value
Customer Lifetime Value (CLV) estimates how much revenue a single customer will generate throughout their relationship with your business. By understanding CLV, you can focus on nurturing your most profitable customers. Key performance indicators (KPIs) help assess how well your CLV strategies contribute to business growth.
Here’s the basic formula for CLV, broken into three main components:
| Component | Calculation | Example |
|---|---|---|
| Average Purchase Value | Total Revenue / Number of Purchases | $50 |
| Purchase Frequency Rate | Number of Purchases / Number of Unique Customers | 4 times per year |
| Average Customer Lifespan | Years of Active Purchasing | 5 years |
To calculate CLV:
CLV = (Average Purchase Value × Purchase Frequency) × Average Customer Lifespan
For example: ($50 × 4) × 5 = $1,000 [6].
Key Performance Indicators
A strong business typically achieves an LTV to Customer Acquisition Cost (CAC) ratio of at least 3:1, with outstanding results reaching a 5:1 ratio [7].
Strategies to Boost CLV
- Customer Experience Matters: 86% of customers are willing to pay more for a better experience [7].
- Personalized Onboarding: Effective onboarding can retain up to 76% of customers. For instance, Airbnb customizes the process by collecting travel preferences [7].
- Premium Memberships: Companies like Revolut offer exclusive benefits – such as priority support and higher transaction limits – to increase customer loyalty [7].
These approaches align with retention and loyalty-building tactics, ensuring measurable improvements in customer engagement.
Measuring Success
Track metrics like direct costs, indirect costs, retention rates, and purchase frequency to gauge the impact of your CLV efforts.
"CLV quantifies the total revenue generated by a customer over time." – Pratik Ghadge, Editor, CustomerCompany.com [6]
For B2B businesses, consider combining historical CLV models (based on past purchase data) with predictive models (using machine learning to forecast future behavior). This dual approach provides a fuller picture of customer value and highlights areas for growth [6].
4. Customer Satisfaction Score
CSAT is a straightforward way to measure if your efforts align with what customers expect. It focuses on how well key interactions meet customer needs and highlights areas for improvement.
Calculating CSAT
To calculate CSAT, divide the number of positive responses by the total responses, then multiply by 100. For example, if 80 out of 100 responses are positive, the CSAT score is 80%. In the B2B world, a good CSAT score typically falls between 75% and 85% [8].
Strategic Implementation
Nils Vinje, VP of Customer Success at Rainforest QA, suggests sending surveys at critical points in the customer journey – like after onboarding – to gather meaningful feedback [8].
Impact on Business Growth
CSAT goes beyond measuring satisfaction; it also influences growth. Here are some key insights:
| Business Impact | Statistical Evidence |
|---|---|
| Customer Retention | A 5% increase in retention can boost profits by 25–95% [9] |
| Response Expectations | 79% of customers expect feedback within 24 hours [9] |
| Benchmark Performance | Scores between 75–85% reflect strong satisfaction [8] |
Continuous Feedback Loop
Matt Hogan, VP of Customer Success at Intricately, emphasizes the value of ongoing surveys:
"Deploying customer satisfaction surveys on a rolling basis will keep the constant feedback loop going. The technology available makes it easy to manage this. This way, you’re getting a sense of people’s feelings when you’re not releasing products or doing anything different." [8]
To make the most of CSAT surveys, send them after key moments, such as:
- Completing customer onboarding
- Resolving a support ticket
- Conducting product training
- Reaching a six-month relationship milestone
Tracking these trends over time helps refine your approach, setting the groundwork for evaluating customer effort in the next phase.
sbb-itb-400598f
5. Customer Effort Score
Customer Effort Score (CES) measures how simple it is for customers to interact with your business. According to Gartner, reducing customer effort predicts loyalty more effectively than just increasing satisfaction [11].
How Effort Impacts Loyalty
Here’s how customer effort influences loyalty:
| Customer Experience | Impact on Loyalty |
|---|---|
| High-Effort Interaction | 96% become less loyal |
| Low-Effort Interaction | Only 9% become less loyal |
| Effort Score Improvement | 22% boost in loyalty |
| Low-Effort Cost Reduction | Up to 40% fewer repeat calls |
Measuring CES the Right Way
After key interactions, survey customers with the statement: "[Company Name] made it easy for me to handle my issue." Use a scale from 1 (strongly disagree) to 7 (strongly agree) [11].
Key moments to measure CES include:
- After support interactions
- Post-product implementation
- Following feature adoption
- During renewal processes
Tracking CES at these points helps identify areas for improvement and directly impacts loyalty and revenue.
Why CES Matters
"Measuring customer effort gives you the information you need to make your customers’ lives easier. When customers indicate that something is difficult to do, you can then make changes to reduce effort. Doing so consistently will dramatically improve the customer experience, increase customer loyalty, and decrease churn." [11]
Ways to Improve CES
Making customer interactions smoother can lead to stronger loyalty. Focus on these strategies:
- First Contact Resolution (FCR): Solve issues during the first interaction to avoid follow-ups and reduce frustration.
- Context Preservation: Share customer interaction history across teams, so customers don’t have to repeat themselves [11].
- Simplify Access: Streamline support channels to reduce the need for customers to switch between methods, cutting channel switching by 54% [11].
When customers experience low effort, 94% say they’d buy again, and 88% are willing to spend more [10]. These improvements are crucial for building long-term relationships in B2B environments.
6. Customer Engagement Data
Focusing on reducing customer effort is just the beginning. Measuring customer engagement takes your strategy to the next level, showing how well your efforts resonate. Companies that effectively engage their B2B customers see 63% lower customer attrition and a 55% higher share of wallet [12].
Key Engagement Metrics to Monitor
Tracking the right metrics helps you understand how effective your engagement efforts are. Here are some important ones:
| Metric Type | What to Measure | Why It Matters |
|---|---|---|
| Website Activity | Session duration, bounce rate | Gauges content interest and effectiveness |
| Platform Usage | Monthly/Daily Active Users (MAU/DAU) | Shows patterns of consistent interaction |
| Social Media | Brand mentions, sentiment analysis | Reflects customer perception and satisfaction |
| Email Marketing | Open rates, click-through rates | Reveals content relevance and engagement |
| Product Adoption | Feature usage, implementation success | Highlights areas needing improvement |
Implementing Effective Measurement
To make engagement data actionable, focus on these steps:
- Define Clear Metrics
Choose metrics that align with your business goals. Focus on data that directly impacts customer relationships and revenue. - Integrate Multiple Data Sources
Combine insights from various platforms, such as:- Website analytics
- CRM tools
- Social media platforms
- Customer feedback surveys
- Product usage data
- Monitor Customer Sentiment
Keep an eye on brand mentions and analyze customer sentiment across channels. This helps identify trends, pain points, and opportunities for improvement.
"Customer engagement encompasses how customers connect with and experience your brand through your products/services, website, application and other touchpoints." – Sprinklr [12]
This approach ensures your engagement strategy is guided by actionable insights.
Engagement Technology Stack
The right tools can streamline your engagement efforts. Here’s a breakdown of useful tools:
| Tool Category | Purpose | Outcome |
|---|---|---|
| Content Management | Track content performance | Allocate resources more effectively |
| Social Media Marketing | Monitor brand perception | Strengthen customer relationships |
| Email Marketing | Measure campaign performance | Improve communication strategies |
| Lead Capture | Track conversion rates | Enhance acquisition efforts |
| Event Marketing | Measure participation | Increase customer involvement |
Keep in mind that high engagement doesn’t always mean a great customer experience. Focus on meaningful, value-driven interactions that build stronger relationships, rather than overwhelming customers with excessive communication [13].
7. Customer Feedback Systems
Effective feedback systems help businesses gauge success by collecting insights from various touchpoints. These insights reveal customer needs and guide improvements.
Feedback Collection Methods
| Collection Method | Best Use Case | Impact Measured |
|---|---|---|
| In-app Surveys | Immediate product experience | Feature adoption rates |
| Email Feedback | Post-purchase satisfaction | Customer satisfaction trends |
| Website Forms | General service quality | Support effectiveness |
| SMS Surveys | Quick responses | Response rate tracking |
| QR Code Feedback | Event or location-specific | Engagement metrics |
Real-World Example: Spotify
Spotify used an Email Verification API to achieve impressive results. They reduced bounce rates from 12.3% to 2.1%, improved email deliverability by 34%, verified 45 million subscribers, and generated $2.3M in revenue.
Framework for Analyzing Feedback
1. Data Organization
Centralize all feedback to identify trends and prioritize areas for improvement.
2. Response Management
Use automated workflows to address customer feedback promptly. For example, First Commonwealth achieved an NPS of +70 in less than five months by systematically acting on feedback [14].
"We can now coach and develop our teams to excel at service delivery, based on what actually matters to our members." – Drew Cano, First Commonwealth [14]
Personalizing Feedback Requests
Tailor feedback requests to the recipient’s role, align surveys with critical customer interactions, keep them concise, and involve account teams to improve response rates.
Integrating Technology
Modern feedback systems should work seamlessly with existing tools:
| Tool Type | Purpose | Business Impact |
|---|---|---|
| CRM Systems | Consolidate customer data | Comprehensive feedback view |
| Support Platforms | Track issues | Faster resolutions |
| Analytics Tools | Spot trends | Predictive insights |
| Communication Apps | Team collaboration | Quicker response times |
To complete your customer-focused evaluation, consider using the LuckBoosters Organizational Audit.
8. LuckBoosters Organizational Audit
The LuckBoosters Organizational Audit examines customer-focused strategies across key areas to pinpoint opportunities for improvement. It provides a clear roadmap to help businesses grow with a customer-first approach.
Assessment Components
| Area | Metrics Evaluated | Business Impact |
|---|---|---|
| Marketing Landscape | Traffic patterns, conversion rates | Boosted revenue potential |
| Sales Alignment | Lead quality, response times | Better close rates |
| Customer Success | Onboarding effectiveness, support metrics | Higher retention |
| Tech Stack | Platform integration, automation efficiency | Smoother operations |
| Content Strategy | Engagement metrics, persona alignment | More precise targeting |
Implementation Process
The audit takes 3–6 weeks and follows three key phases:
- Data Collection
Interviews with key teams uncover operational insights and challenges. - Analysis & Assessment
This phase dives into critical areas such as:- Effectiveness of lead nurturing
- Performance across market segments
- Accuracy of buyer personas
- Engagement levels with content
- Alignment between internal teams
- Strategic Recommendations
The final report outlines actionable steps, including:- Streamlining processes
- Optimizing the technology stack
- Improving team collaboration
- Strategies for increasing revenue
These steps are designed to ensure measurable results, with success tracked through specific metrics.
"We don’t just hand over a lengthy slide deck and call it a day. Instead, we actively engage with you, walking you through the analysis and recommendations in our report." – LuckBoosters [15]
Measuring Impact
| Metric Category | Key Indicators | Timeline |
|---|---|---|
| Sales Performance | Lead quality scores, conversion rates | Monthly |
| Marketing ROI | Campaign results, channel performance | Quarterly |
| Customer Success | Satisfaction scores, retention rates | Ongoing |
| Team Alignment | Cross-functional collaboration efficiency | Weekly |
The audit acts as a guide for improving customer-focused practices, helping organizations refine their marketing strategies and align sales efforts for better results.
Conclusion
By using the eight measurement methods outlined, businesses can create a focused strategy to drive lasting customer success. These methods offer a clear framework for tracking progress and identifying areas for improvement.
Prioritizing Your Metrics
Here’s how different goals align with key metrics:
| Business Goal | Primary Metrics |
|---|---|
| Customer Loyalty | Customer Retention Rate, NPS |
| Revenue Growth | Customer Lifetime Value |
| Operational Excellence | Customer Effort Score |
| Strategic Alignment | Customer Feedback Systems |
Implementation Strategy
To effectively implement these metrics, start with clear baselines and realistic improvement goals. Focus on aligning metrics with your business objectives.
- Start With Core Metrics
Focus first on essential metrics like retention rates and NPS. Establish baselines and set specific improvement targets. - Develop Effective Systems
Create systems that integrate feedback collection, data consolidation, and real-time monitoring for a more streamlined approach. - Act on Insights
Use your metrics to make informed adjustments to your strategies regularly.
Consistent evaluation ensures your strategy stays on track and responsive to changes.
Continuous Improvement
Regularly reviewing these metrics strengthens your growth strategy and helps refine your customer approach. Conducting organizational audits can reveal areas for improvement and ensure your strategy adapts to evolving customer needs.
Long-term success depends on commitment across all teams. As Joseph Soares from IBPROM Corp. puts it:
"By genuinely understanding and acting on customer needs, businesses can adapt services, significantly boosting satisfaction and loyalty." [1]